
See Every Rack, Feed and Circuit — the Moment It Changes
RouteMaster Monitoring connects your power distribution, cooling and network gear into one live view. Poll every device over SNMP, stream the telemetry to a central engine, and know about a problem before your users do.
One platform for the whole power & cooling chain
From the utility feed to the last patch panel — every layer reports into the same dashboard.
Power (PDU & UPS)
Input/output voltage, load per phase, current, power factor, battery autonomy and bypass state — polled from every PDU and UPS.
Environment
Temperature, humidity, water leak and door sensors at the rack and room level, so hot spots never go unnoticed.
Network Gear
Switches, routers and links — availability, uptime, interface errors and latency, probed continuously.
Cooling
CRAC / in-row unit status, setpoints, return-air temperature and fan speed, correlated against rack load.
Battery Health
Runtime remaining, capacity, last self-test result and replacement forecast for every battery string.
Generators & ATS
Fuel level, run-hours, transfer switching and engine state, so backup power is verified — not assumed.
A familiar, single-pane view
Every asset gets a status pill that changes colour the instant a threshold is crossed.
| Asset | Location | Metric | Reading | Status |
|---|---|---|---|---|
| PDU-A1 | Hall 1 · Rack 04 | Load / phase | 62% · 41% · 58% | Online |
| UPS-02 | Power Room | Battery autonomy | 18 min | On battery |
| CRAC-03 | Hall 2 | Return air | 27.4 °C | Nominal |
| PDU-C7 | Hall 2 · Rack 12 | Output current | 31.9 A | Overload |
| ATS-Main | Utility Entry | Source | Normal | Nominal |
| SW-Core-1 | Network Room | Uptime | 412 d | Online |
Straight from the monitoring console
Real views from the platform — rack statistics, port-level detail and an alarm panel where the alarm type is fully editable.
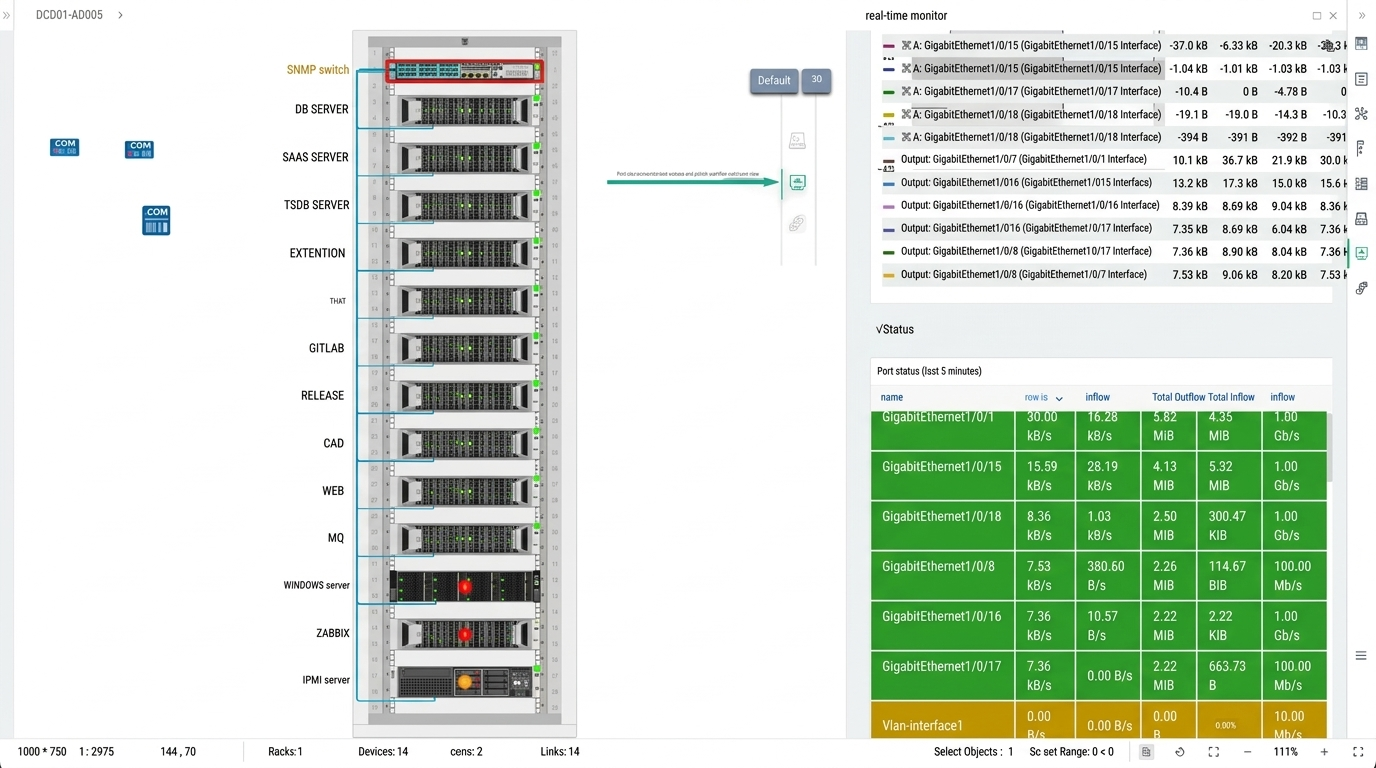
Switch statistics in a rack
Live port and traffic counters for a switch mounted at the rack level.
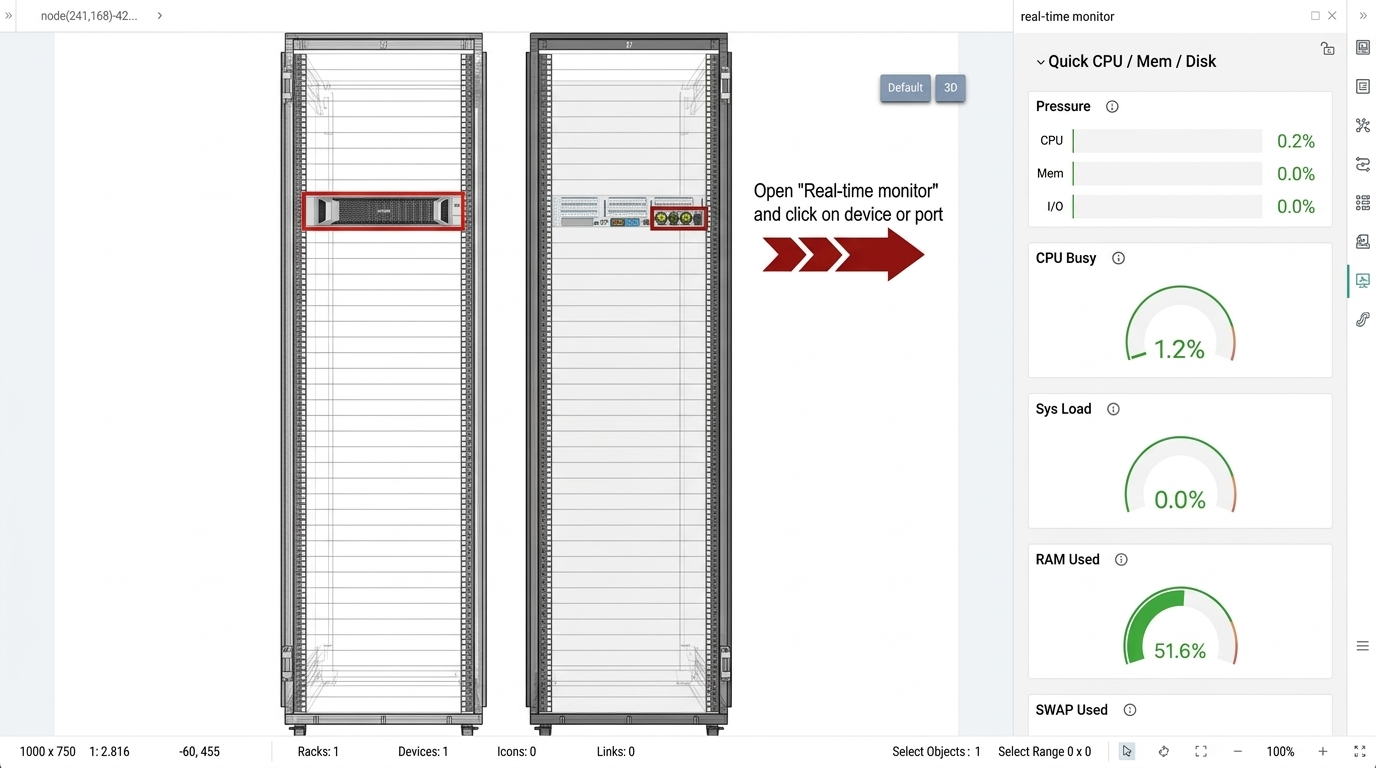
Server statistics in a rack
Per-server metrics — CPU, memory and interface load — mapped to its physical position.
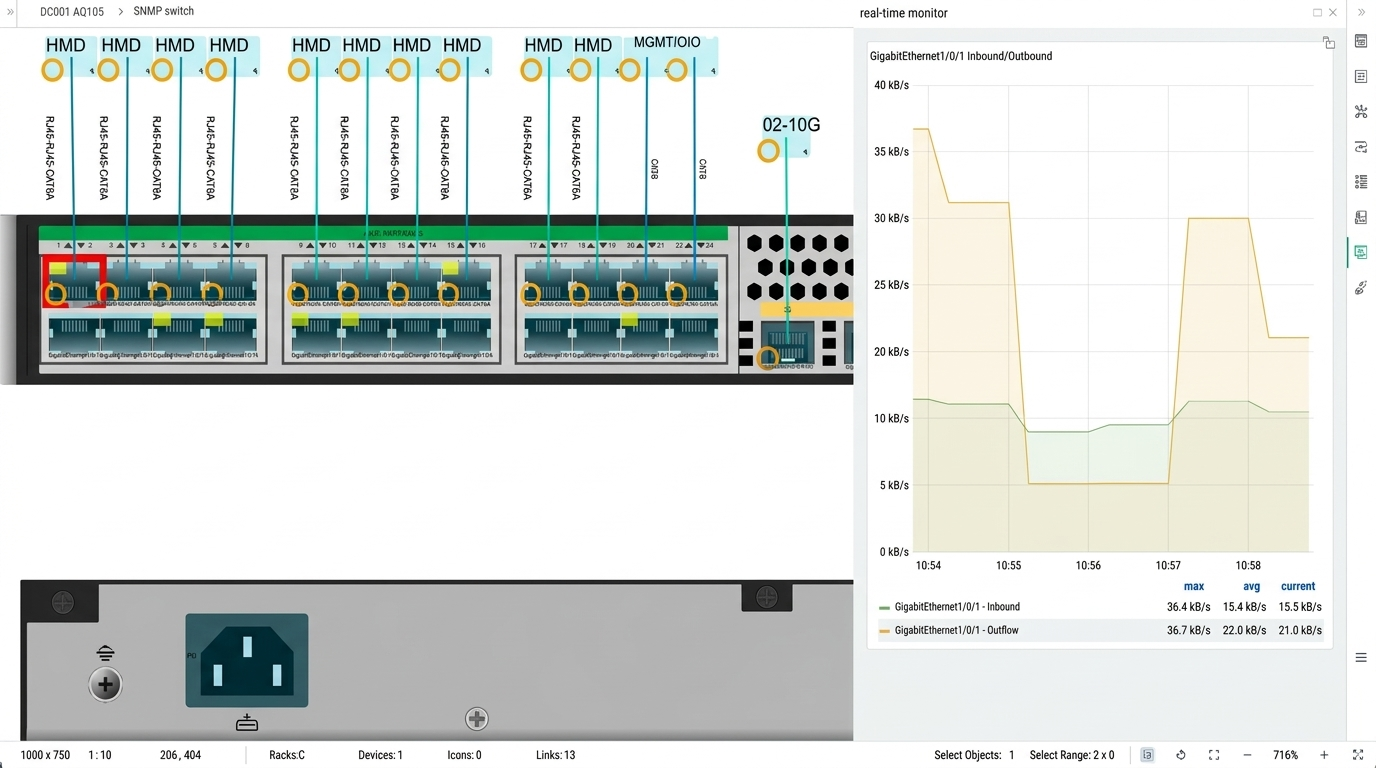
Switch port detail
Drill down to a single port: errors, throughput and link state at a glance.
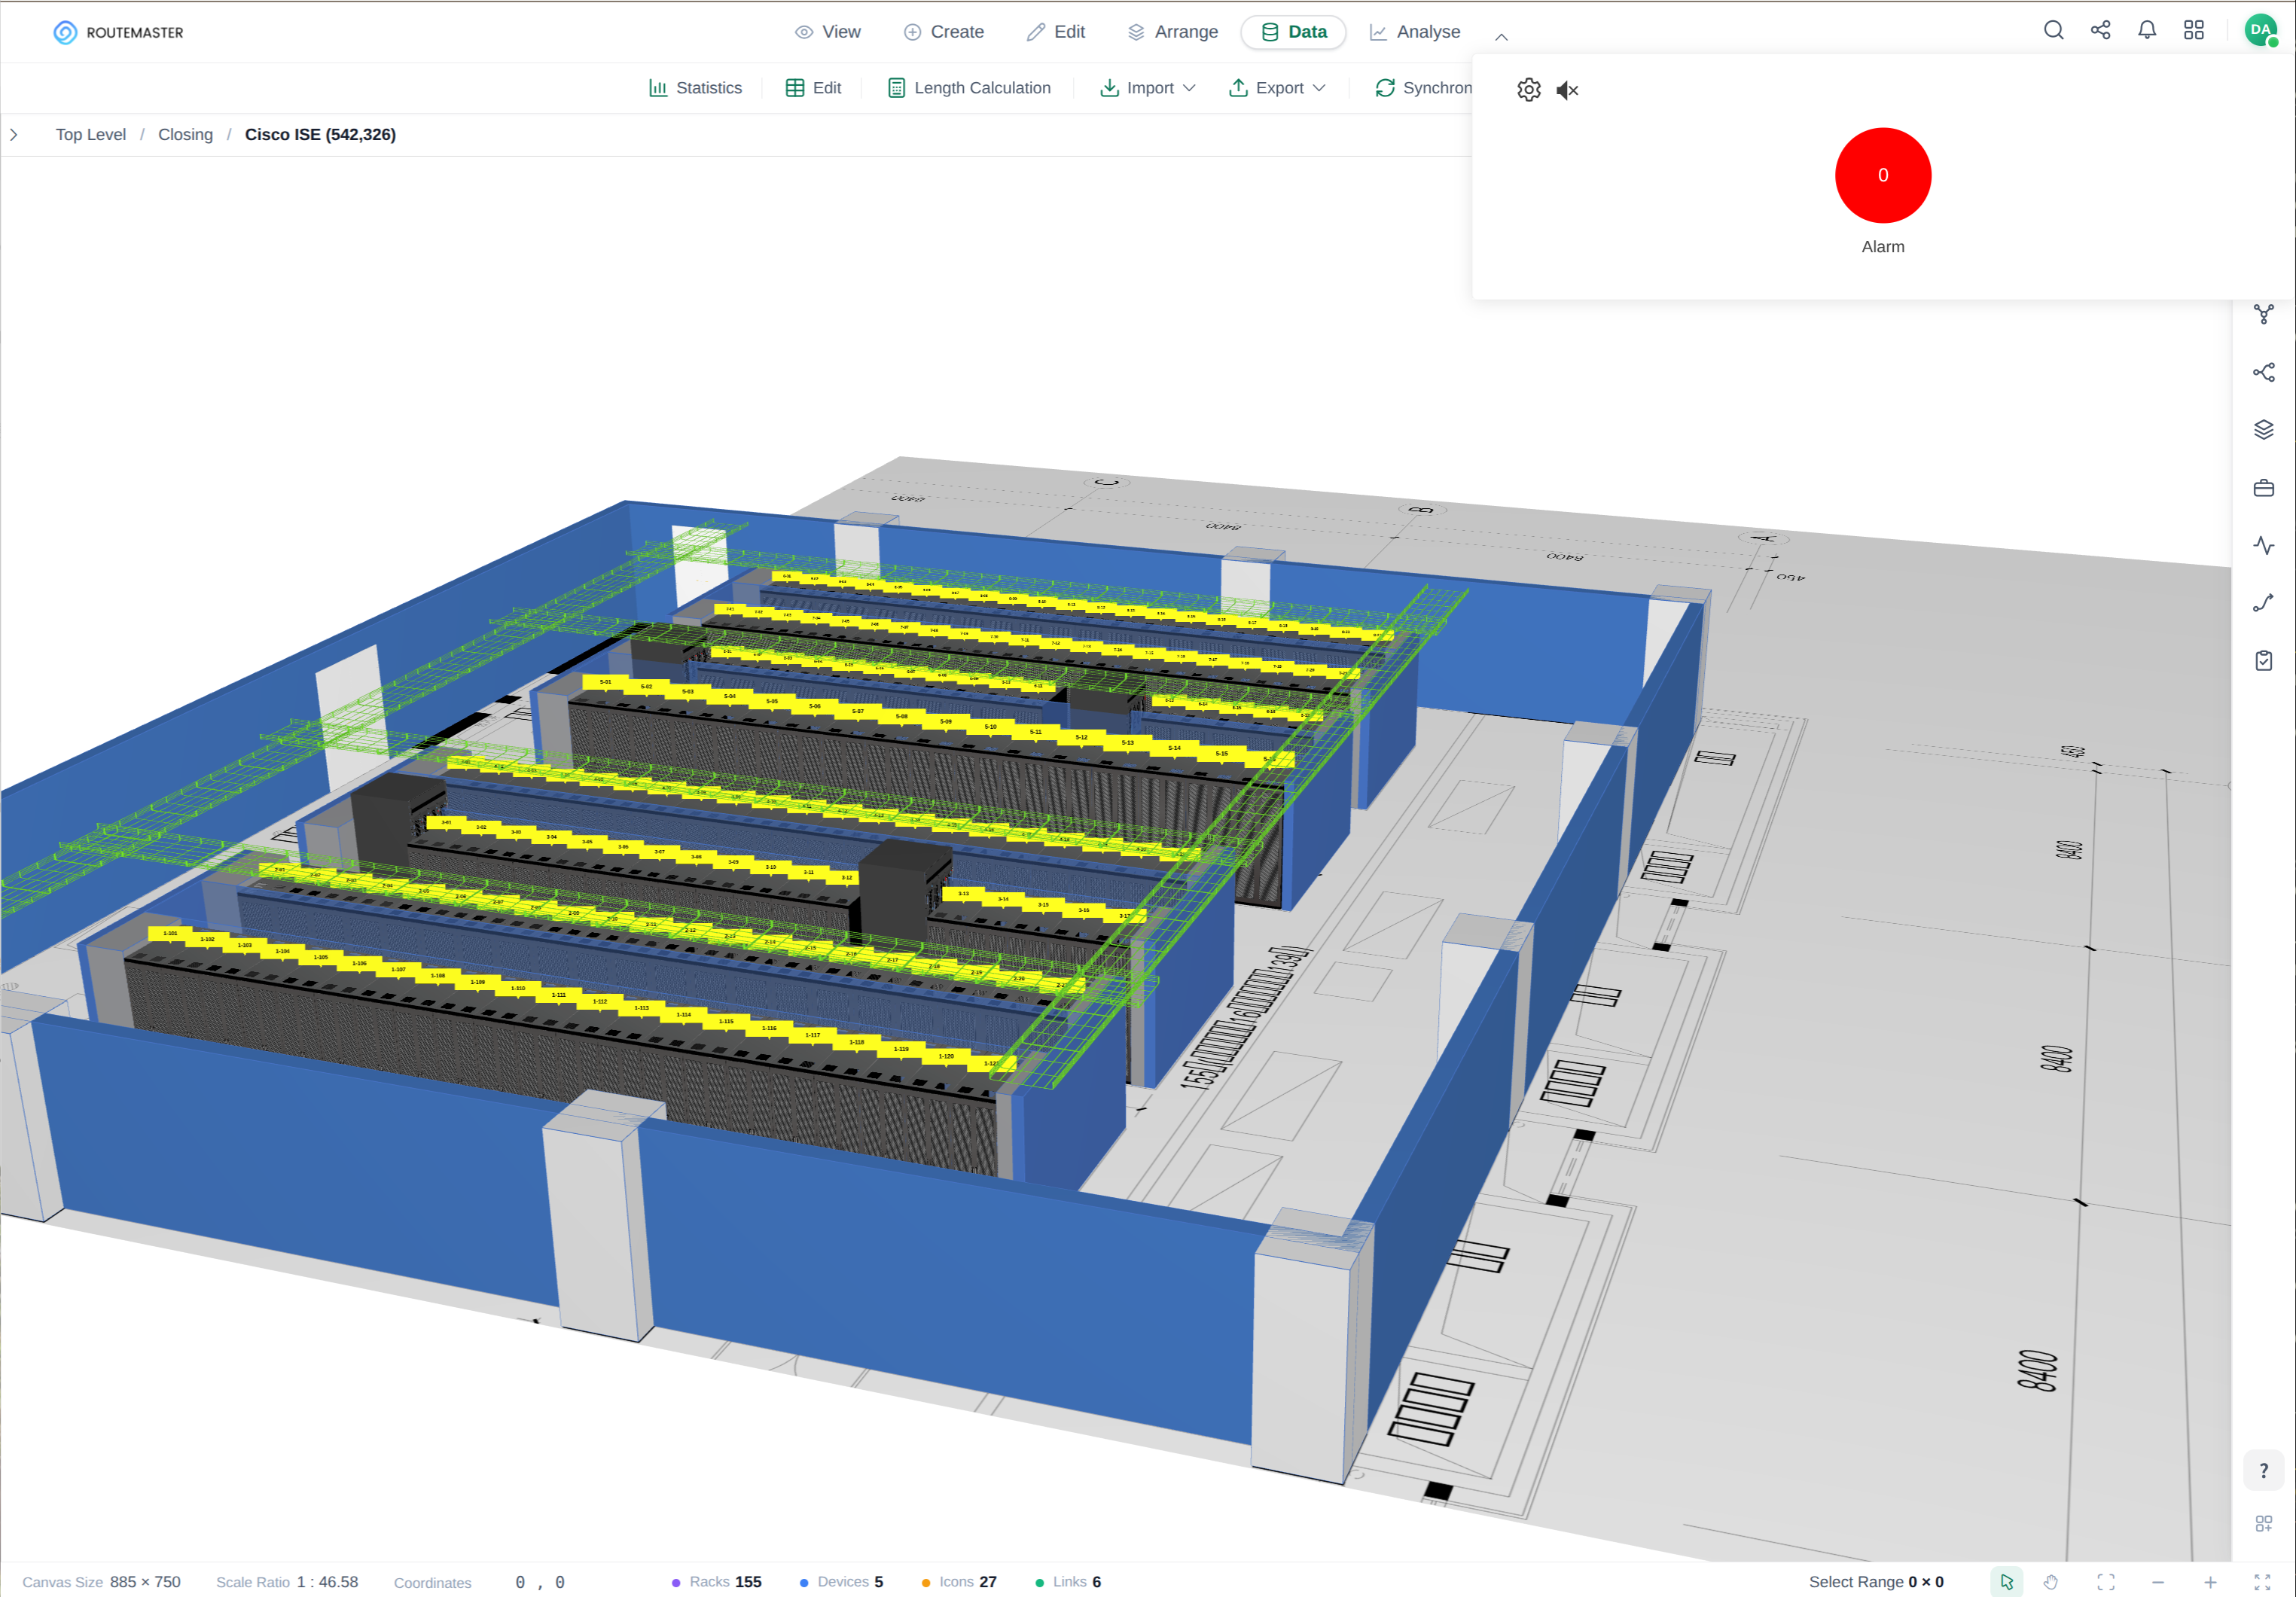
Alarm panel — types are editable
Where alarms live in the platform, and how you tailor each alarm type to your own thresholds.
From device to dashboard in four steps
A standards-based pipeline — no proprietary lock-in, no agents to install on your equipment.
Discover
The engine reads your asset register and finds every SNMP-enabled device automatically.
Poll
Agents query each device on a fixed interval, using vendor MIBs to pull the right metrics.
Evaluate
Threshold and trend rules turn raw numbers into clear, de-duplicated alerts.
Notify & Sync
Alarms land in your dashboard, email and the platform view — with the affected asset coloured in place.
Less guesswork, fewer surprises
Prevent, don't react
Catch a rising load or falling battery before it becomes an outage.
Capacity you can trust
Real load data per rack and phase tells you exactly where headroom remains.
One truth for every team
Facilities, network and management work from the same live numbers.
Open standards
SNMP and industry protocols — no rip-and-replace of existing hardware.
Audit-ready history
Every reading timestamped, so incidents come with evidence, not opinions.
Runs on your terms
Self-hosted on your network, so sensitive telemetry never leaves your control.
Put your infrastructure on the map — live
We'll walk you through a real deployment: sensors, polling, thresholds and the alarms your team actually wants.
Book a DemoBook a Demo
Tell us a bit about your project and we'll get back to you.